

Question: Verify the normality requirement for the data analyzed in Example 2. Approach Obtain the residuals and draw the normal probability plot. Data from Example 2
Verify the normality requirement for the data analyzed in Example 2.
Approach Obtain the residuals and draw the normal probability plot.
Data from Example 2
A researcher is interested in the effect of four diets on the weight gain of newborn rats. The researcher randomly assigns rats from the same mother to each treatment so that a set of four rats constitutes a block. In blocking by mother, we are removing any variability in weight gain due to genetic differences. The researcher identifies five mother rats that each had four offspring, for a total of 20 rats. For each block (sibling rats), the researcher randomly assigns the experimental units (rats) to a treatment using randomly generated integers from 1 to 4 . After six months, she records the weight gain of the 20 rats (in grams) and obtains the data in Table 10. Is there sufficient evidence to conclude that the weight gains of the rats on the four diets differ at the \(\alpha=0.05\) level of significance?
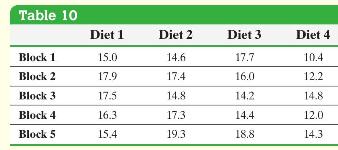
Table 10 Diet 1 Diet 2 Diet 3 Diet 4 Block 1 15.0 14.6 17.7 10.4 Block 2 17.9 17.4 16.0 12.2 Block 3 17.5 14.8 14.2 14.8 Block 4 16.3 17.3 14.4 12.0 Block 5 15.4 19.3 18.8 14.3
Step by Step Solution
3.39 Rating (152 Votes )
There are 3 Steps involved in it
Figure 12 on the next page shows the normal probability p... View full answer

Get step-by-step solutions from verified subject matter experts