

Question: Voting Pattern The following data represent the proportion of Americans who voted in the 2012 presidential election at various levels of educational attainment. If we
Voting Pattern The following data represent the proportion of Americans who voted in the 2012 presidential election at various levels of educational attainment.
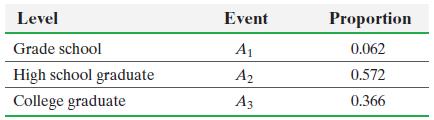
If we let D represent the event that a randomly selected American who voted in the 2012 presidential election voted Democratic, we can also obtain the following probabilities:

(a) What is the probability that a randomly selected American who voted in the 2012 presidential election voted Democratic?
(b) What is the probability that an American who voted Democratic has graduated from college?
(c) What is the probability that an American who voted Democratic has a grade school education?
Level Event Proportion Grade school A1 0.062 High school graduate A2 0.572 College graduate A3 0.366
Step by Step Solution
3.48 Rating (148 Votes )
There are 3 Steps involved in it

Get step-by-step solutions from verified subject matter experts