

Question: The following data represent the earned-run average (ERA) of the top 40 pitchers in both the American League and National League in 2010. ERA is
The following data represent the earned-run average (ERA) of the top 40 pitchers in both the American League and National League in 2010.
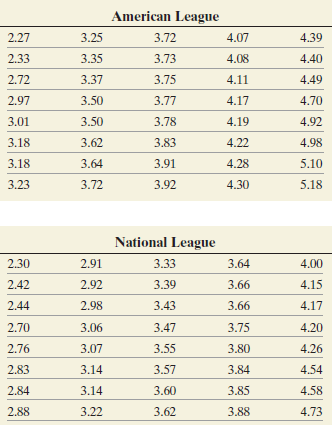
ERA is the average number of earned runs given up per 9 innings. Be sure to take into account the fact that the National League does not have a designated hitter.
(a) Why would it be appropriate to use frequencies to compare the two leagues?
(b) Construct a frequency distribution for each league. To make an easy comparison, create each frequency distribution so that the lower class limit of the first class is 2.0 and the class width is 0.50.
(c) On the same graph, construct a frequency polygon for the American and National Leagues.
(d) On the same graph, construct a frequency ogive for the American and National Leagues.
(e) Which league appears to have better pitchers? Support your opinion.
American League 2.27 3.25 3.72 4.07 4.39 2.33 3.35 3.73 4.08 4.40 3.75 2.72 3.37 4.11 4.49 3.50 3.77 2.97 4.17 4.70 4.92 3.01 3.50 3.78 4.19 3.18 3.62 3.83 4.22 4.98 3.18 3.64 3.91 4.28 5.10 3.23 3.72 3.92 4.30 5.18 National League 2.30 2.91 3.33 3.64 4.00 2.42 3,66 2.92 3.39 4.15 2.44 2.98 3.43 3.66 4.17 2.70 3.06 3.47 3.75 4.20 2.76 3.07 3.55 3.80 4.26 2.83 3.14 3.57 3.84 4.54 3.60 2.84 3.14 3.85 4.58 2.88 3.22 3.62 3.88 4.73
Step by Step Solution
3.47 Rating (160 Votes )
There are 3 Steps involved in it
a Since the sample sizes are the same we can use frequencies to compare the t... View full answer

Get step-by-step solutions from verified subject matter experts