

Question: Refer to the Baseball 2018 data, which report information on the 30 Major League Baseball teams for the 2018 season. Consider the following variables: number
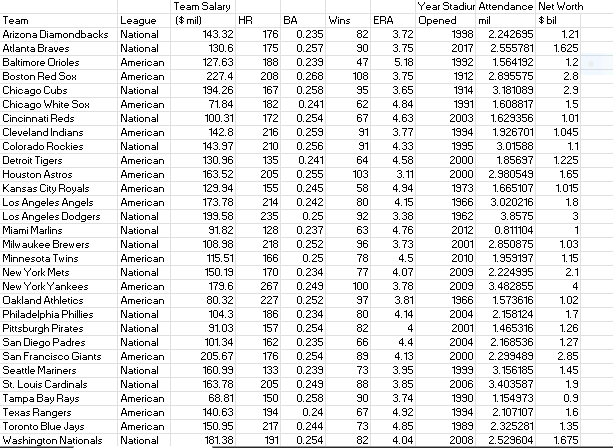
Refer to the Baseball 2018 data, which report information on the 30 Major League Baseball teams for the 2018 season. Consider the following variables: number of wins, payroll, season attendance, whether the team is in the American or National League, and the number of home runs hit.
Prepare a report on the team salaries. Be sure to answer the following questions in your report.
- Over the last decade, the mean attendance per team followed a normal distribution with a mean of 2.45 million per team and a standard deviation of .71 million. Compute the mean attendance per team for the 2018 season. Determine the likelihood of a sample mean attendance this large or larger from the population.
- Develop a 95% confidence interval for the mean number of home runs per team.
- Develop a 95% confidence interval for the mean batting average by each team.
- Develop a 95% confidence interval for the mean earned run average (ERA) for each team.
- Conduct a test of hypothesis to determine whether the mean salary of the teams was different from $100.0 million. Use the .05 significance level.
- Using a 5% significance level, conduct a test of hypothesis to determine whether the mean attendance was more than 2,000,000 per team.
- At the .05 significance level, can we conclude that there is a difference in the mean salary of teams in the American League versus teams in the National League?
- At the .05 significance level, can we conclude that there is a difference in the mean home attendance of teams in the American League versus teams in the National
- League?
- Compute the mean and the standard deviation of the number of wins for the 10 teams with the highest salaries.
- Do the same for the 10 teams with the lowest salaries.
- At the .05 significance level, is there a difference in the mean number of wins for the two groups (highest and lowest salaries)?
- At the .05 significance level, is there a difference in the mean attendance for the two groups (highest and lowest salaries)
Step by Step Solution
There are 3 Steps involved in it
1 Expert Approved Answer
Step: 1 Unlock

Question Has Been Solved by an Expert!
Get step-by-step solutions from verified subject matter experts
Step: 2 Unlock
Step: 3 Unlock