

Question: 12. Which pairwise comparison shows the strongest effect? Question relate to the following repeated-measures ANOVA output. a) Conditions 1 and 2 b) Conditions 2 and
12. Which pairwise comparison shows the strongest effect?
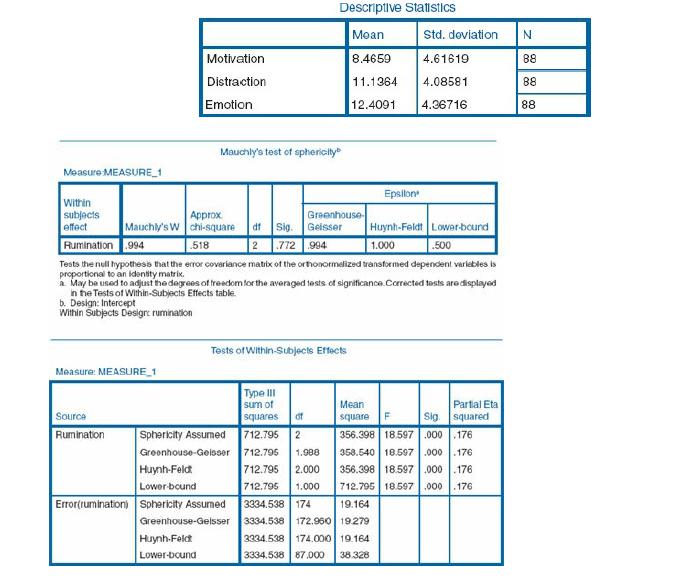
Question relate to the following repeated-measures ANOVA output.
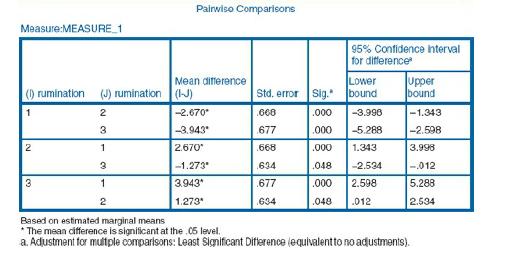
a) Conditions 1 and 2
b) Conditions 2 and 3
c) Conditions 1 and 3
d) We cannot tell
Descriptive Statistics Moan Std. deviation N Motivation 8.4659 4.61619 88 Distraction 11.1364 4.08581 88 Emotion 12.4091 4.36716 88 Mauchly's test of sphericity Measure MEASURE 1 Within subjects Approx effect Rumination 994 518 2 772 994 Epsilon Greenhouse- Huynh-Feldt Lower-bound 1.000 .500 Mauchly's W chi-square df Sig. Geisser Tests the null hypothesis that the error covariance matrix of the orthonormalized transformed dependent variables is proportional to an identity matrix. a. May be used to adjust the degrees of freedom for the averaged tests of significance. Corrected tests are displayed in the Tests of Within-Subjects Effects table. b. Design: Intercept Within Subjects Design: rumination Measure: MEASURE_1 Tests of Within-Subjects Effects Type III sum of Mean Source squares of square F Sig. Partial Eta squared Rumination Sphericity Assumed 712.795 2 356.398 18.597 .000 .176 Greenhouse-Geisser 712.795 1.988 358.540 18.597 .000 .176 | Huynh-Feld 712.795 2.000 356.398 18.597 .000 .176 Lower-bound Error(rumination) Sphericity Assumed Greenhouse-Gelsser Huynh-Falc 712.795 1.000 3334.538 174 Lower-bound 712.795 18.597 .000 .176 19.164 3334.538 172.960 19.279 3334.538 174.000 19.164 3334.538 87.000 38.328
Step by Step Solution
There are 3 Steps involved in it

Get step-by-step solutions from verified subject matter experts