

Question: 3. How should the contingency table be described? a) 11 b) 12 c) 32 d) 22 Female Male Total Normal blood pressure Observed 375 335
3. How should the contingency table be described?
a) 1×1
b) 1×2
c) 3×2
d) 2×2
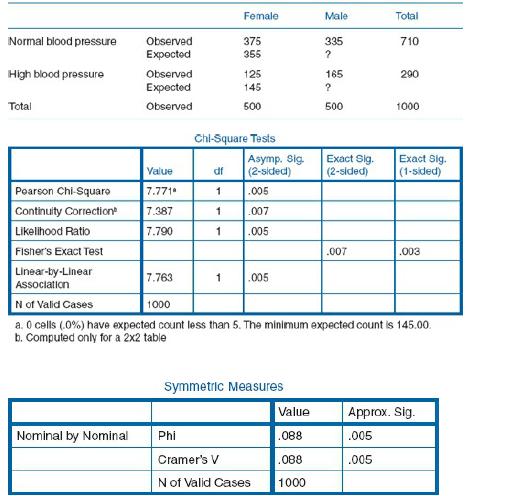
Female Male Total Normal blood pressure Observed 375 335 710 Expected 355 ? High blood pressure Observed 125 165 290 Expected 145 ? Total Observed 500 500 1000 Chi-Square Tests Asymp. Sig Exact Sig Exact Sig. Value df (2-sided) (2-sided) (1-sided) Pearson Chi-Squaro 7.771 1 .005 Continuity Correction' 7.387 1 007 Likelihood Ratio 7.790 1 .005 Fisher's Exact Test .007 .003 Linear-by-Linear 7.763 1 .005 Association N of Valid Cases 1000 a. 0 cells (.0%) have expected count less than 5. The minimum expected count is 145.00. b. Computed only for a 2x2 table Symmetric Measures Value Approx. Sig. Nominal by Nominal Phi .088 .005 Cramer's V .088 .005 N of Valid Cases 1000
Step by Step Solution
There are 3 Steps involved in it

Get step-by-step solutions from verified subject matter experts