

Determine the following probabilities from the curve (x) diagrammed in Exercise 6.1 (a). (a) P( 0 <
Question:
Determine the following probabilities from the curve ∫(x) diagrammed in Exercise 6.1 (a).
(a) P( 0 < X < .2)
(b) P(1.8 < X < 2.0)
(c) P(.4 < X < .6)
Data from in Exercise 6.1
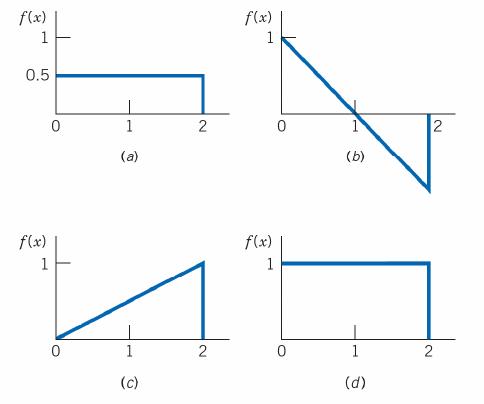
Which of the functions sketched below could be a probability density function for a continuous random variable? Why or why not?
Fantastic news! We've Found the answer you've been seeking!
Step by Step Answer:
The probabilites are a b c P 4 X 6 5 ...View the full answer

Answered By
Shaira grace
I have experience of more than ten years in handing academic tasks and assisting students to handle academic challenges. My level of education and expertise allows me communicate eloquently with clients and therefore understanding their nature and solving it successfully.
4+ Reviews
10+ Question Solved
Related Book For 
Statistics Principles And Methods
ISBN: 9781119497110
8th Edition
Authors: Richard A. Johnson, Gouri K. Bhattacharyya
Question Posted:
