

Henri Theil, a famous economist/econometrician, analyzed the demand for textiles in the Netherlands during the period 1923-1939,
Question:
Henri Theil, a famous economist/econometrician, analyzed the demand for textiles in the Netherlands during the period 1923-1939, using a general linear model framework. In particular, he specified the relationship between per-capita textile consumption, real price of textiles, and per capita real income as
\(Y_{t}=\beta_{1} \mathrm{p}_{t}^{\beta_{2}} \mathrm{i}_{t}^{\beta_{3}} e^{\varepsilon_{t}}, t=1923, \ldots, 1939\)
where \(Y_{t}=\) per capita textile consumption in year \(t\), represented as an index with base year 1925;
\(p_{t}=\) retail price index of clothing divided by a general cost-of-living index in year \(t\), represented as an index with base year 1925, \(i_{t}=\) real income per capita in year \(t\), defined as the total money income of private consumers divided by the population size and a general cost of living index, represented as an index with base year 1925, \(\varepsilon_{t} \sim\) iid \(N\left(0, \sigma^{2}ight), t=1923, \ldots, 1939\).
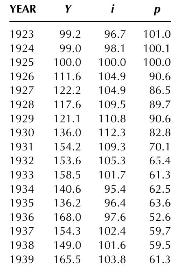
The data used by Theil in estimating the demand relationship is presented in the following table.
(a) Present the statistical model in a form that is consistent with the general linear model framework (variables should be measured in a way that coincides with the way they are used in the GLM specification). Can the random sample \(\left(\mathrm{Y}_{1}, \ldots, \mathrm{Y}_{n}ight)\) be interpreted as a random sample from a population distribution? Why or why not?
(b) Define complete (and minimal) sufficient statistics for the parameters \((\boldsymbol{\beta}, \sigma)\).
(c) Define the BLUE estimator of \(\left.\left(\ln \left(\beta_{1}ight), \beta_{2}, \beta_{3}ight)ight)\) ? Generate a BLUE estimate for this vector.
(d) Define the MVUE for the vector \(\left.\left(\ln \left(\beta_{1}ight), \beta_{2}, \beta_{3}ight)ight)\). Justify that your estimator is in fact the MVUE. Generate a MVUE estimate for the vector.
(e) What is the MVUE for \(\left(\beta_{2}+\beta_{3}ight)\), i.e., what is the MVUE for the degree of homogeneity of the demand function in terms of relative prices and real income? Justify that your estimator is the MVUE for \(\left(\beta_{2}+\beta_{3}ight)\). Generate an MVUE estimate of \(\left(\beta_{2}+\beta_{3}ight)\).
(f) Define the probability distribution of the MVUE for \(\left(\beta_{2}+\beta_{3}ight)\). What is the probability distribution of the MVUE for \(\left.\left(\ln \left(\beta_{1}ight), \beta_{2}, \beta_{3}ight)ight)\) ?
(g) Present conditions under which the MVUE of \(\left(\ln \left(\mid \beta_{1}ight)ight.\), \(\left.\beta_{2}, \beta_{3}ight)\) would be: (1) a consistent estimator, and (2) an asymptotically normally distributed estimator.
(h) Define the MVUE for \(\sigma^{2}\). Justify that the estimator is, in fact, the MVUE. Generate an MVUE estimate of \(\sigma^{2}\).
(i) Present conditions under which the MVUE for \(\sigma^{2}\) would be a consistent estimator.
(j) Estimate the probability that your MVUE estimator of the price elasticity of demand will generate an estimate that is within \(\pm .15\) of the true price elasticity. You may use estimates of unknown parameters in generating this probability estimate.
(k) Is \(\hat{\mathrm{E}}\left(\mathrm{Y}_{t}ight)=e^{\hat{\beta}_{1}^{*}} p_{t}^{\hat{\beta}_{2}} i_{t}^{\hat{\beta}_{3}}\), where \(\left(\hat{\beta}_{1}^{*}, \hat{\beta}_{2}, \hat{\beta}_{3}ight)\) is the BLUE estimator of \(\left.\left(\ln \left(\beta_{1}ight), \beta_{2}, \beta_{3}ight)ight)\), a consistent estimator of \(\mathrm{E}\left(Y_{t}ight)\) for given values of \(i\) and \(i_{t}\) ?
(1) Is the estimator in (k) BLUE? MVUE?
Step by Step Answer:


Mathematical Statistics For Economics And Business
ISBN: 9781461450221
2nd Edition
Authors: Ron C.Mittelhammer
