

Question: Is the correlation in Figure 9 about (a) .1, (b) .5, (c) .9, or (d) .7? Data from in Figure 9 y 10- 00 8
Is the correlation in Figure 9 about (a) .1, (b) .5, (c) .9, or (d) –.7?
Data from in Figure 9
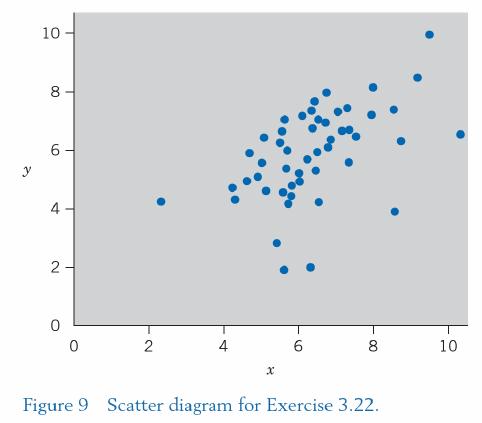
y 10- 00 8 6- 4 T 2- 0 2 4 :. 6 - 00 8 Figure 9 Scatter diagram for Exercise 3.22. 10
Step by Step Solution
★★★★★
3.24 Rating (179 Votes )
There are 3 Steps involved in it
1 Expert Approved Answer
Step: 1 Unlock

There is a southwestnorth... View full answer
Question Has Been Solved by an Expert!
Get step-by-step solutions from verified subject matter experts
Step: 2 Unlock
Step: 3 Unlock