

Question: Look at the scatterplot in Figure 11.3 with regression lines, which is from the MRSA bacteriaemia surveillance in acute National Health Service Trusts in England
Look at the scatterplot in Figure 11.3 with regression lines, which is from the MRSA bacteriaemia surveillance in acute National Health Service Trusts in England from April 2002 to March 2003.
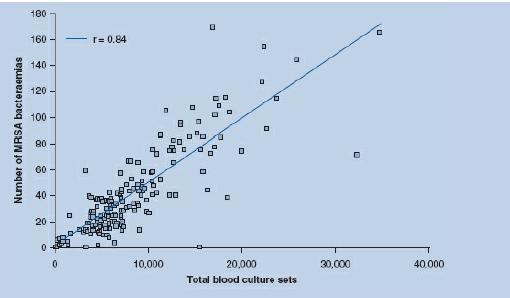
Give the following information:
a) The value of a
b) The value of r2
c) For every increase in 10,000 of total blood culture sets, the number of MRSA bacteriaemias increases by approximately ______________
Number of MRSA bacteraemias 180 160- r=0.84 140 120 100 80 60 40 20- 0 . D " : D D Q . a 10,000 20,000 30,000 40.000 Total blood culture sets
Step by Step Solution
There are 3 Steps involved in it
1 Expert Approved Answer
Step: 1 Unlock

Question Has Been Solved by an Expert!
Get step-by-step solutions from verified subject matter experts
Step: 2 Unlock
Step: 3 Unlock