

Match the following values of r with the correct diagrams (Figure 8). (a) r = .3
Question:
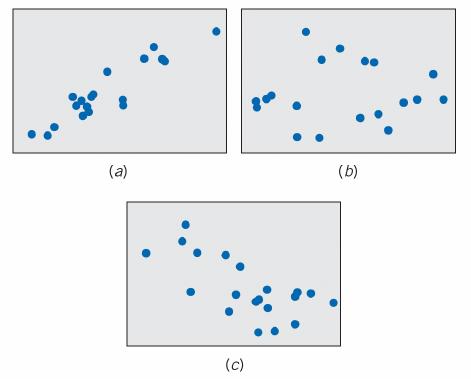
Match the following values of r with the correct diagrams (Figure 8).
(a) r = – .3
(b) r = .l
(c) r = .9
Data from in Figure 8
Fantastic news! We've Found the answer you've been seeking!
Step by Step Answer:
Data from in Fi...View the full answer

Answered By
Labindao Antoque
I graduated in 2018 with a Bachelor of Science degree in Psychology from Dalubhasaan ng Lungsod ng San Pablo. I tutored students in classes and out of classes. I use a variety of strategies to tutor students that include: lecture, discussions about the subject matter, problem solving examples using the principles of the subject matter being discussed in class , homework assignments that are directed towards reinforcing what we learn in class , and detailed practice problems help students to master a concept. I also do thorough research on Internet resources or textbooks so that I know what students need to learn in order to master what is being taught in class .
0 Reviews
10+ Question Solved
Related Book For 
Statistics Principles And Methods
ISBN: 9781119497110
8th Edition
Authors: Richard A. Johnson, Gouri K. Bhattacharyya
Question Posted:
