

Question: Plot the data shown in the following table using a column chart: Number of Constructed Bridges by Year Superstructure Type 1989 1990 1991 Steel 5
Plot the data shown in the following table using a column chart: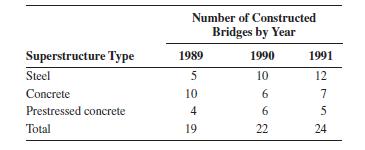
Number of Constructed Bridges by Year Superstructure Type 1989 1990 1991 Steel 5 10 12 Concrete Prestressed concrete 14 10 6 6 275 Total 19 22 24
Step by Step Solution
There are 3 Steps involved in it
1 Expert Approved Answer
Step: 1 Unlock

Question Has Been Solved by an Expert!
Get step-by-step solutions from verified subject matter experts
Step: 2 Unlock
Step: 3 Unlock