

The Dow Jones average provides an indication of overall market level. The changes in this average, (current
Question:
The Dow Jones average provides an indication of overall market level. The changes in this average, (current year) - (previous year) summarize the year's activity. Changes for 48 recent years yield the following frequency table. The left-hand endpoint is excluded.
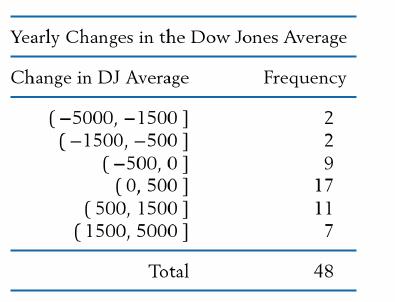
(a) Calculate the relative frequency for the intervals.
(b) Plot the relative frequency histogram.
(c) What proportion of the changes are not positive?
(d) Comment on the location and shape of the distribution.
Fantastic news! We've Found the answer you've been seeking!
Step by Step Answer:
a we obtain the values 00417 00417 01875 03542 02292 01458 b The widths are ...View the full answer

Answered By
Shehar bano
I have collective experience of more than 7 years in education. my area of specialization includes economics, business, marketing and accounting. During my study period I remained engaged with a business school as a visiting faculty member and did a lot of business research. I am also tutoring and mentoring number of international students and professionals online for the last 7 years.
4+ Reviews
10+ Question Solved
Related Book For 

Statistics Principles And Methods
ISBN: 9781119497110
8th Edition
Authors: Richard A. Johnson, Gouri K. Bhattacharyya
Question Posted:
