

Question: The production function for a commodity can be approximated over a restricted range of relevant input levels by a linear relationship of the form (mathbf{Y}=mathbf{x}
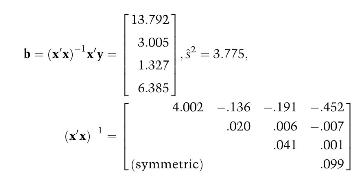
The production function for a commodity can be approximated over a restricted range of relevant input levels by a linear relationship of the form \(\mathbf{Y}=\mathbf{x} \boldsymbol{\beta}+\boldsymbol{\varepsilon}\). The columns of \(\mathbf{x}\) include, in order, a column of 1's, and three column vectors representing observations on labor, energy, and capital input levels. Thirty observations on weekly production levels yielded the following summary statistics:
(a) Test the joint significance of the input variables for explaining the expected level of production using a size .05 test.
(b) Test the significance of the input variables individually. Which input variables contribute significantly to the explanation of the expected level of output? Be sure to explain the basis for your conclusion.
(c) Define confidence interval outcomes for each of the marginal products of the inputs. Use .95 confidence coefficients. What do these confidence intervals mean?
(d) Test the hypothesis that expected output is \(\leq 35\) when labor, energy and capital are applied at levels 8, 4, and 3, respectively. Use a size .05 test.
(e) Calculate a confidence interval outcome for the expected level of production at the input levels indicated in (d). Use a . 95 confidence coefficient. What is the meaning of this confidence interval?
(f) Test the hypothesis that the variance of the production process is \(\geq 6\) at a . 10 level of significance. Assume normality in conducting this test. What information would you need to conduct an asymptotically valid test of the hypothesis in the absence of normality?
b = (x'x) x'y = - 13.792 3.005 1.327 6.385 3= 3.775, 4.002.136.191 .020 L(symmetric) 4521 .006 - .007 .041 .001 .099
Step by Step Solution
3.40 Rating (159 Votes )
There are 3 Steps involved in it

Get step-by-step solutions from verified subject matter experts