

Question: Using the data from Problem 2.18 and the following population totals, construct an area chart that shows the total and the breakdown of the total
Using the data from Problem 2.18 and the following population totals, construct an area chart that shows the total and the breakdown of the total population in rural, suburban, and central city.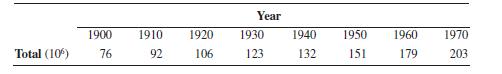
Year 1900 1910 1920 1930 1940 1950 1960 1970 Total (10%) 76 92 106 123 132 151 179 203
Step by Step Solution
There are 3 Steps involved in it
1 Expert Approved Answer
Step: 1 Unlock

Question Has Been Solved by an Expert!
Get step-by-step solutions from verified subject matter experts
Step: 2 Unlock
Step: 3 Unlock