

Question: In Figure 3.2, why do the intervals span from 0.5 to 1.5, from 1.5 to 2.5, etc., when all of the numbers in the dataset
In Figure 3.2, why do the intervals span from 0.5 to 1.5, from 1.5 to 2.5, etc., when all of the numbers in the dataset are whole numbers?
Figure 3.2
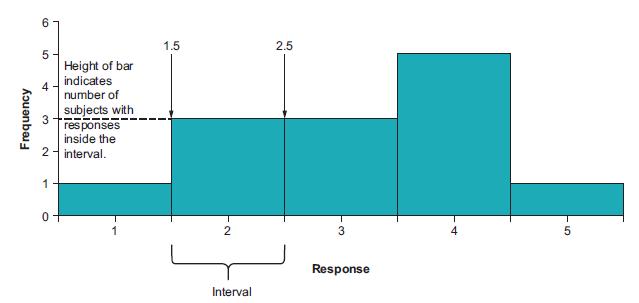
1.5 2.5 5- Height of bar indicates 4 number of subjects with responses inside the 2- interval. 1 1 2 4 Response Interval kouanbai
Step by Step Solution
★★★★★
3.44 Rating (179 Votes )
There are 3 Steps involved in it
1 Expert Approved Answer
Step: 1 Unlock

ANSWER The intervals in a frequency distribution table are determined b... View full answer
Question Has Been Solved by an Expert!
Get step-by-step solutions from verified subject matter experts
Step: 2 Unlock
Step: 3 Unlock