

Question: When comparing the frequency tables in this chapter (Table 3.3 and the frequency table in the guided practice section), Myeongsun noticed that the proportions in
When comparing the frequency tables in this chapter (Table 3.3 and the frequency table in the guided practice section), Myeongsun noticed that the proportions in the bottom row of each table (labeled “Total”) were exactly 1.000.
a. Why did both of these tables – which were built from different sets of data – have the same proportions in their bottom rows?
b. Why were the proportions equal to 1.000?
c. Will all frequency tables have this proportion in their “Total” row? Why or why not?
Table 3.3
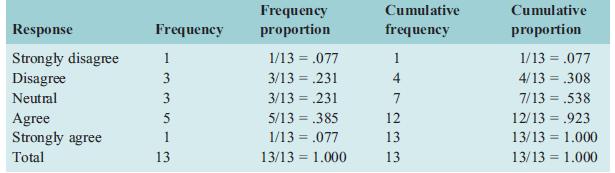
Frequency proportion Cumulative Cumulative Response Frequency frequency proportion Strongly disagree Disagree 1 1/13 = .077 1 1/13 = .077 3 3/13 = .231 4 4/13 = .308 Neutral 3 3/13 = .231 7 7/13 = .538 Agree Strongly agree Total 5 5/13 = .385 12 12/13 = .923 %3D 1 1/13 = .077 13 13/13 = 1.000 %3D 13 13/13 = 1.000 13 13/13 = 1.000
Step by Step Solution
3.40 Rating (172 Votes )
There are 3 Steps involved in it
a Both of these tables have the same proportions in their bottom rows because they rep... View full answer

Get step-by-step solutions from verified subject matter experts