

Question: (a) Use the ACS dataset to create a plot for the overall age distribution in the US, and comment on the distribution. (b) Give and
(b) Give and interpret a 95% confidence interval for the average age of a US resident.
(c) Create a plot for the age distribution in the US by racial group, and comment on what you see.
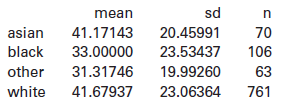
(d) Does average age differ by racial group in the US? State hypotheses, calculate a p-value, and make a conclusion in context. Some relevant sample statistics are given below:
(e) After doing the analysis in (d), give a 95% confidence interval for the average age of an Asian US resident. How does this compare to your answer for all US residents from (b)?
The American Community Survey, administered by the US Census Bureau, is given every year to a random sample of about 3.5 million households (about 3% of all US households). It has been crucial for government and policy decisions, and helps to determine how over 400 billion dollars of government funds are distributed each year. Unfortunately, the House voted in May 2012 to eliminate this valuable source of information. Data on a random sample of 1% of all US residents are made public (after ensuring anonymity), and we have selected a random sub-sample of n = 1000 from the 2010 data, stored in ACS.
mean sd 20.45991 23.53437 70 106 63 761 asian black other white 41.17143 33.00000 31.31746 41.67937 19.99260 23.06364
Step by Step Solution
3.58 Rating (162 Votes )
There are 3 Steps involved in it
a Age is a quantitative variable so we can visualize it with a histogram Peoples ages appear to be relatively evenly distributed between the ages of 0 ... View full answer

Get step-by-step solutions from verified subject matter experts