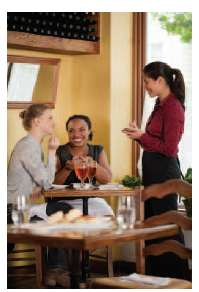
Data 2.12 on page 119 introduces a dataset containing information on customers tipping patterns in a restaurant.
Question:
(a) What are the cases? What is the sample size?
(b) What are the variables? Identify each variable as quantitative or categorical.
(c) The variable PctTip includes information on the tip as a percent of the bill. Use technology to find the mean tip percentage, the standard deviation, and the five number summary. How large or small does a tip percentage have to be to qualify as an outlier relative to this dataset?
(d) Use technology to create a histogram of PctTip and describe its shape.
(e) Use technology to create a two-way table of Credit (yes or no depending on whether the bill was paid with a credit card) and Day (the day of the week). Compute the proportion of bills paid with a credit card on Thursday; do the same for Friday. Does there appear to be an association between whether it is Thursday or Friday and whether a person pays with a credit card or cash? Why do you think this might be so?
(f) We might be interested in how the tip percentage, in the PctTip variable, varies for different servers (Server)? What graph should be used to examine a relationship between these two variables? Use technology to create such a graph and comment on the relationship. Which server appears to make the highest percent tips?
(g) Does the size of the bill (Bill) influence the tip percentage (PctTip)? In addressing this question, what is the explanatory variable? What is the response variable? Use technology to draw a scatterplot. Are there any outliers in the scatterplot? Ignoring the outliers, does there appear to be a positive, negative, or no relationship between these two variables?
(h) Use technology to find the correlation between Bill and PctTip.
Data 2.12 on page 119
The owner of a bistro called First Crush in Potsdam, New York, is interested in studying the tipping patterns of its patrons. He collected restaurant bills over a two-week period that he believes provide a good sample of his customers. The data from 157 bills are stored in RestaurantTips and include the amount of the bill, size of the tip, percentage tip, number of customers in the group, whether or not a credit card was used, day of the week, and a coded identity of the server.

Step by Step Answer:

Statistics Unlocking The Power Of Data
ISBN: 9780470601877
1st Edition
Authors: Robin H. Lock, Patti Frazer Lock, Kari Lock Morgan, Eric F. Lock, Dennis F. Lock


