

Question: Data 2.2 on page 61 includes information on longevity (typical lifespan), in years, for 40 species of mammals. (a) Use the data, available in MammalLongevity,
Data 2.2 on page 61 includes information on longevity (typical lifespan), in years, for 40 species of mammals.
(a) Use the data, available in MammalLongevity, and StatKey or other technology to test to see if the average lifespan of mammal species is different from 10 years. Include all details of the test: the hypotheses, the p-value, and the conclusion in context.
(b) Use the result of the test to determine whether μ = 10 would be included as a plausible value in a 95% confidence interval of average mammal lifespan. Explain.
Data 2.2 on page 61
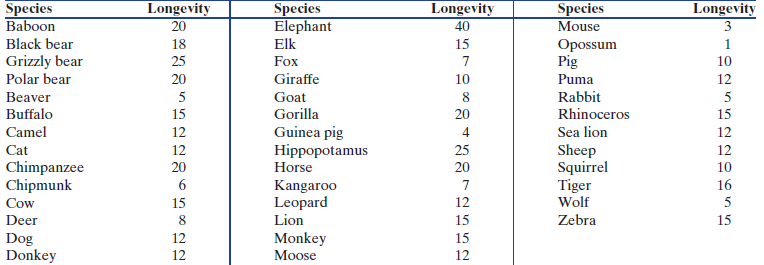
The dataset MammalLongevity includes information on longevity (typical lifespan), in years, for 40 species of mammals as well as information on length of gestation for these same mammals.21 The longevity data are given in Table 2.14.
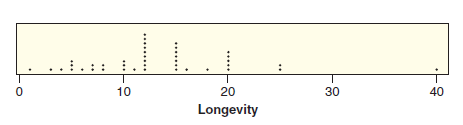
A dotplot of the longevity data is shown in Figure 2.6. We see a horizontal scale from 0 to 40 to accommodate the range of lifespans. Quite a few mammals have lifespans of 12, 15, and 20 years. All but one typically live between 1 and 25 years, while the elephant€™s lifespan of 40 years is much higher than the rest. The value of 40 years appears to be an outlier for longevity in this group of mammals.
Figure 2.6
Species Elephant Species Baboon Black bear Longevity Longevity Longevity Species Mouse 40 20 18 25 20 5 15 15 Elk Fox Opossum Grizzly bear Polar bear Pig Puma Rabbit 10 10 Giraffe Goat Gorilla Guinea pig Hippopotamus Horse 12 Beaver 8. Rhinoceros Sea lion Sheep Squirrel Tiger Wolf Zebra Buffalo Camel Cat 20 4 25 15 12 12 20 12 12 10 16 | Chimpanzee 20 Chipmunk Kangaroo Leopard Lion Monkey Moose 15 12 15 Cow Deer 15 8. 12 12 Dog Donkey 15 12
Step by Step Solution
3.44 Rating (180 Votes )
There are 3 Steps involved in it
a We are testing H 0 10 vs H a 10 where represents the mean longevity in years ... View full answer

Get step-by-step solutions from verified subject matter experts