

Every Fourth of July, Nathans Famous in New York City holds a hot dog eating contest, which
Question:
Exercise 2.98 Table 2.21
Year .................Hot Dogs
2011.......................62
2010.......................54
2009.......................68
2008.......................59
2007.......................66
2006.......................54
2005.......................49
2004.......................54
2003.......................45
2002.......................50
Figure 2.70
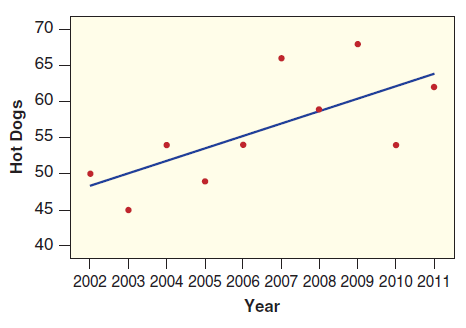
(a) Is the trend in the data mostly positive or negative?
(b) Using Figure 2.70, is the residual larger in 2007 or 2008? Is the residual positive or negative in 2010?
(c) Use technology to find the correlation.
(d) Use technology to find the regression line to predict the winning number of hot dogs from the year.
(e) Interpret the slope of the regression line.
(f) Predict the winning number of hot dogs in 2012. (Bonus: Find the actual winning number in 2012 and compute the residual.)
(g) Why would it not be appropriate to use this regression line to predict the winning number of hot dogs in 2020?
Step by Step Answer:
a The trend is positive with a mild linear relationship b The residual is the ver...View the full answer


Statistics Unlocking The Power Of Data
ISBN: 9780470601877
1st Edition
Authors: Robin H. Lock, Patti Frazer Lock, Kari Lock Morgan, Eric F. Lock, Dennis F. Lock
