

Question: Figure A.13 shows a scatterplot of height and weight for a new sample of 105 college students. Figure A.13 (a) Does there appear to be
Figure A.13
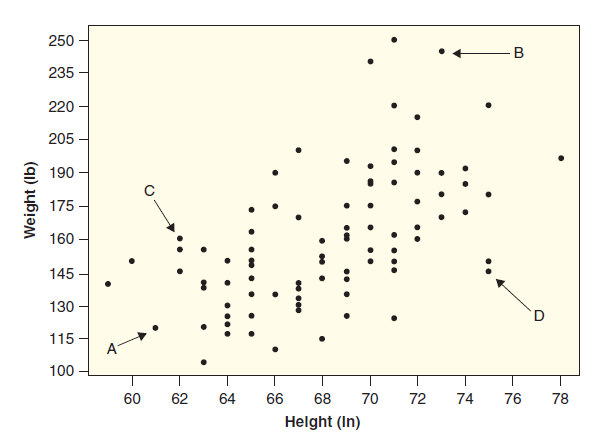
(a) Does there appear to be a positive or a negative relationship in the data?
(b) Describe the body shape of the individuals whose points are labeled by A, B, C, and D.
250 -B 235 220 205 190 175 160 145 130 115 A- 100 76 78 74 70 72 66 68 64 62 60 Helght (In) (q1) 1ybaM
Step by Step Solution
★★★★★
3.38 Rating (164 Votes )
There are 3 Steps involved in it
1 Expert Approved Answer
Step: 1 Unlock

a The general trend in this data appears to be up and to the right so the... View full answer
Question Has Been Solved by an Expert!
Get step-by-step solutions from verified subject matter experts
Step: 2 Unlock
Step: 3 Unlock