

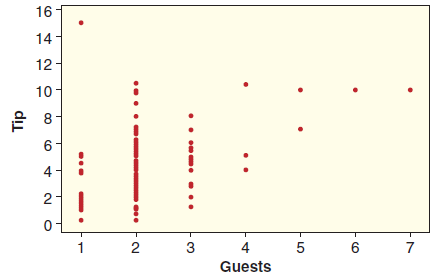
Question: How much larger do tips get with larger parties? Figure D.3 shows a scatterplot between the size of the tip and the number of guests.
Figure D.3
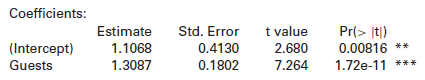
Residual standard error: 2.098 on 155 degrees of freedom
Multiple R-squared: 0.254, Adjusted R-squared: 0.2492
F-statistic: 52.77 on 1 and 155 DF, p-value: 1.715e-11
(a) Interpret the value of the coefficient for Guests in context.
(b) A server begins to wait on a table with three guests. What is her predicted tip?
(c) The server calculates a 95% confidence interval for the average tip for a table of three guests to be (4.57, 5.49), and a 95% prediction interval to be (0.86, 9.20), but is unsure what these intervals tell about how much she should expect to get as a tip. Help her interpret both intervals.
16 14 12 10 : 8- 6 4 2- 6 2 3 4 5 Guests Coefficients: Estimate 1.1068 1.3087 (Intercept) Guests Std. Error t value 2.680 Pr(> It) 0.00816 ** *** 0.4130 0.1802 1.72e-11 7.264
Step by Step Solution
3.30 Rating (165 Votes )
There are 3 Steps involved in it
a For every additional guest the predicted tip ... View full answer

Get step-by-step solutions from verified subject matter experts