

In Data 2.9 on page 103, we discuss the relationship between a presidents approval rating when running
Question:
Table 2.29
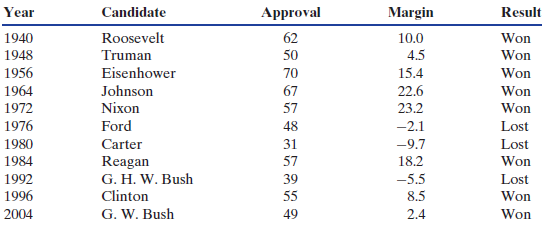
(a) In how many of the 11 elections listed did the incumbent president lose? Since 1940, what percent of the time has the sitting president lost his bid for re-election?
(b) Which president had the highest approval rating? Which president had the highest margin of victory? Identify these two points on the scatterplot.
Data 2.9 on page 103
When a US president runs for re-election, how strong is the relationship between the president€™s approval rating and the outcome of the election? Table 2.29 includes all the presidential elections since 1940 in which an incumbent was running and shows the presidential approval rating at the time of the election and the margin of victory or defeat for the president in the election.
Step by Step Answer:
a The incumbent lost 3 times and won 8 times We have 311 0273 Since 1...View the full answer


Statistics Unlocking The Power Of Data
ISBN: 9780470601877
1st Edition
Authors: Robin H. Lock, Patti Frazer Lock, Kari Lock Morgan, Eric F. Lock, Dennis F. Lock
