

Refer to Example 12, which compared two groups of seven dogs each in terms of their time
Question:
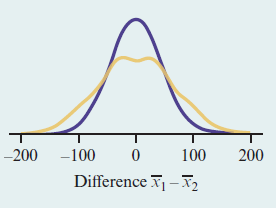
a. What would the mean, standard error, and approximate shape of the theoretical sampling distribution of xÌ…1 - xÌ…2 be if the sample sizes were large?
b. Comment on how the permutation sampling distribution of xÌ…1 - xÌ…2 differs from the theoretical, large-sample one.
c. Consider the one-sided alternative Ha: μ1 > μ2. If the actually observed difference in sample means were 100, would the P-values computed from each sampling distribution be the same or different? Explain.
The word "distribution" has several meanings in the financial world, most of them pertaining to the payment of assets from a fund, account, or individual security to an investor or beneficiary. Retirement account distributions are among the most...
Fantastic news! We've Found the answer you've been seeking!
Step by Step Answer:
a For large sample sizes the sampling distribution is ...View the full answer

Answered By
Utsab mitra
I have the expertise to deliver these subjects to college and higher-level students. The services would involve only solving assignments, homework help, and others.
I have experience in delivering these subjects for the last 6 years on a freelancing basis in different companies around the globe. I am CMA certified and CGMA UK. I have professional experience of 18 years in the industry involved in the manufacturing company and IT implementation experience of over 12 years.
I have delivered this help to students effortlessly, which is essential to give the students a good grade in their studies.
2+ Reviews
10+ Question Solved
Related Book For 

Statistics The Art And Science Of Learning From Data
ISBN: 9780321997838
4th Edition
Authors: Alan Agresti, Christine A. Franklin, Bernhard Klingenberg
Question Posted:
