

Question: Suppose that the probability function in Table 11.13 reflects the possible lifetimes (in months after emergence) for fruit flies. Table 11.13 (a) What proportion of
Suppose that the probability function in Table 11.13 reflects the possible lifetimes (in months after emergence) for fruit flies.
Table 11.13
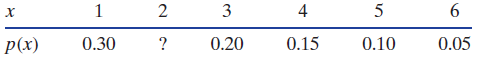 (a) What proportion of fruit flies die in their second month?
(b) What is the probability that a fruit fly lives more than four months?
(c) What is the mean lifetime for a fruit fly?
(d) What is the standard deviation of fruit fly lifetimes?
4 p(x) 0.30 0.20 0.15 0.10 0.05
Step by Step Solution
3.35 Rating (167 Votes )
There are 3 Steps involved in it
Let the random variable X measure fruit fly lifetimes in months a The probabilities ... View full answer

Get step-by-step solutions from verified subject matter experts