

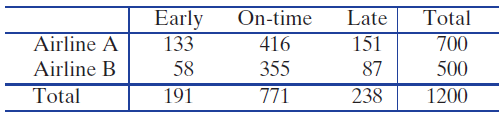
Question: Table 6.10 gives flight arrival numbers from a random sample of flights for two airlines. Test whether there is a difference between the two airlines
Table 6.10
(a) Find the relevant sample proportions in each group and the pooled proportion.
(b) Complete the hypothesis test using the normal distribution and show all details.
Total On-time 416 Late 151 Early 133 Airline A 700 Airline B 58 355 87 500 Total 1200 191 771 238
Step by Step Solution
★★★★★
3.54 Rating (178 Votes )
There are 3 Steps involved in it
1 Expert Approved Answer
Step: 1 Unlock

a For Airline A the proportion arriving late is p A 151700 0216 For Airline B the proportion arrivin... View full answer
Question Has Been Solved by an Expert!
Get step-by-step solutions from verified subject matter experts
Step: 2 Unlock
Step: 3 Unlock