

Question: The computer output below shows a multiple regression model to predict grade point average (GPA) using six variables from the dataset SleepStudy. Gender is coded
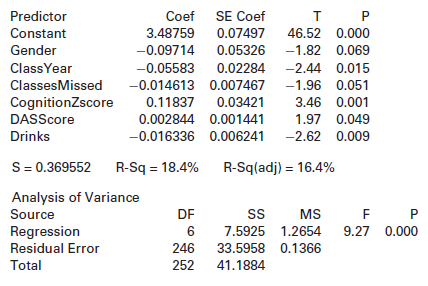
The regression equation is GPA = 3.49 ˆ’ 0.0971 Gender ˆ’ 0.0558 ClassYear ˆ’ 0.0146 ClassesMissed + 0.118 CognitionZscore + 0.00284 DASScore ˆ’ 0.0163 Drinks
(a) Interpret the coefficients of Gender, ClassYear, and ClassesMissed in context. Be sure to pay attention to how the first two variables are coded.
(b) Use the p-value from the ANOVA test to determine whether the model is effective.
(c) Interpret R2 in context.
(d) Which explanatory variable is most significant in the model? Which is least significant?
(e) Which variables are significant at a 5% level?
Predictor Coef SE Coef Constant 3.48759 0.07497 46.52 0.000 -1.82 0.069 Gender -0.09714 0.05326 ClassYear -0.05583 0.02284 -2.44 0.015 ClassesMissed CognitionZscore -0.014613 0.007467 0.11837 -1.96 0.051 0.03421 3.46 0.001 DASScore 0.002844 0.001441 1.97 0.049 Drinks -0.016336 0.006241 -2.62 0.009 R-Sq = 18.4% R-Sq(adj) = 16.4% Analysis of Variance Source DF MS Regression 7.5925 1.2654 9.27 0.000 Residual Error 246 33.5958 0.1366 Total 252 41.1884
Step by Step Solution
3.36 Rating (165 Votes )
There are 3 Steps involved in it
a The coefficient of Gender is 00971 Since males are coded 1 this means that all else being equal a ... View full answer

Get step-by-step solutions from verified subject matter experts