

Question: The following table shows data on gender (coded as 1 = female, 2 = male) and preferred type of chocolate (coded as 1 = white,
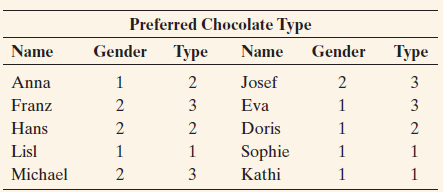
The students€™ teacher enters the data into software and reports a correlation of 0.640 between gender and type of preferred chocolate. He concludes that there is a moderately strong positive correlation between someone€™s gender and chocolate preference. What€™s wrong with this analysis?
Preferred Chocolate Type Gender Type Name Name Gender Type Anna Josef 3 Franz 2 3 Eva 3 Hans Doris Lisl Sophie Michael 2 3 Kathi
Step by Step Solution
★★★★★
3.48 Rating (178 Votes )
There are 3 Steps involved in it
1 Expert Approved Answer
Step: 1 Unlock

The correlation coefficient ... View full answer
Question Has Been Solved by an Expert!
Get step-by-step solutions from verified subject matter experts
Step: 2 Unlock
Step: 3 Unlock
Document Format (2 attachments)
1544_605d88e1f2ecb_675886.pdf
180 KBs PDF File
1544_605d88e1f2ecb_675886.docx
120 KBs Word File