

Question: Three graphs are shown for a linear model: the scatterplot with least squares line, a histogram of the residuals, and a scatterplot of residuals against
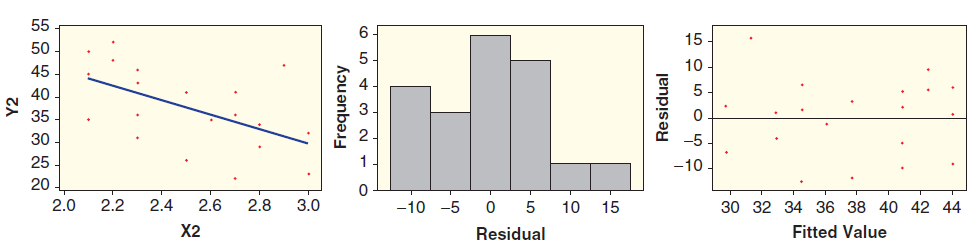
55 15 50 45 10 40 35 30 25 -5 -10 20 2.2 2.0 2.6 2.8 10 15 30 32 34 36 38 40 42 44 2.4 3.0 -10 -5 Residual X2 Fitted Value Y2 Frequency Residual
Step by Step Solution
★★★★★
3.37 Rating (178 Votes )
There are 3 Steps involved in it
1 Expert Approved Answer
Step: 1 Unlock

The conditions all seem to be met There appears to b... View full answer
Question Has Been Solved by an Expert!
Get step-by-step solutions from verified subject matter experts
Step: 2 Unlock
Step: 3 Unlock