

To increase Barack Obamas visibility and to raise money for the campaign leading up to the 2008
Question:
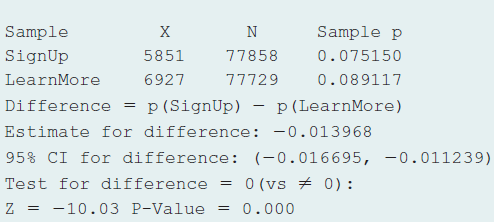
a. Sketch an appropriate graph to compare the sample proportions visually.
b. Show all steps of a significance test, using the computer output. Define any parameters you are using when specifying the hypotheses. Mention whether there is a significant difference at the 0.05 significance level.
c. Interpret the confidence interval shown in the output. Why is this interval more informative than just reporting the P-value?
Fantastic news! We've Found the answer you've been seeking!
Step by Step Answer:
a b 1 Assumptions Categorical response whether visitor clicked button two groups two versions of the ...View the full answer

Answered By
Muhammad Umair
I have done job as Embedded System Engineer for just four months but after it i have decided to open my own lab and to work on projects that i can launch my own product in market. I work on different softwares like Proteus, Mikroc to program Embedded Systems. My basic work is on Embedded Systems. I have skills in Autocad, Proteus, C++, C programming and i love to share these skills to other to enhance my knowledge too.
1+ Reviews
10+ Question Solved
Related Book For 

Statistics The Art And Science Of Learning From Data
ISBN: 9780321997838
4th Edition
Authors: Alan Agresti, Christine A. Franklin, Bernhard Klingenberg
Question Posted:
