

Question: a. A geologist studying thrust faults in a Proterozoic shear zone in southern Wyoming developed the hypothesis that all of the thrust faults formed during
a. A geologist studying thrust faults in a Proterozoic shear zone in southern Wyoming developed the hypothesis that all of the thrust faults formed during a regional north–northwest/south–southeast shortening event. Unfortunately, before she was able to analyze her data she was killed by a grizzly bear. Fortunately, her field notebook survived the attack. With her last breath, the dying geologist whispered to her field assistant: ‘‘Please, do a kinematic analysis of the fault data and find out whether they support or falsify my hypothesis.’’
Use the data from her notebook, tabulated below, to fulfill her dying wish. First construct a plot showing the orientations of the faults, pitch of slickenlines, and slip direction (as in Fig. 10.6b). Then, construct a second plot that shows the extension and shortening axes (as in Fig. 10.6d). There are not enough data to contour, so visually determine the ‘‘best fit’’ shortening axis direction.
In one succinct sentence, explain what your analysis tells you about the dead geologist’s hypothesis.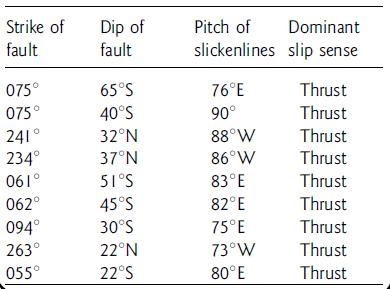
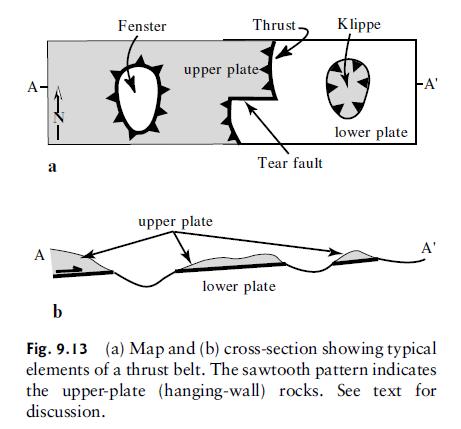
b. Near the shear zone discussed in Part A, above, is a region characterized by faults with a dominantly strike-slip sense of slip. There is a controversy as to whether or not these strike-slip faults are kinematically related to the thrust faults. While continuing the work of her deceased boss, the precocious field assistant developed the hypothesis that the strike-slip faults are tear faults (cf. Fig. 9.13) that formed during the same episode of thrusting as the faults examined in Part A. Tabulated below are her data on six faults. Test this hypothesis by constructing two plots, as before, one plot of the faults and slickenlines, and the second plot of the extension and shortening axes for the faults tabulated below. Succinctly discuss the kinematic compatibility or lack of compatibility of the strike-slip and thrust faults.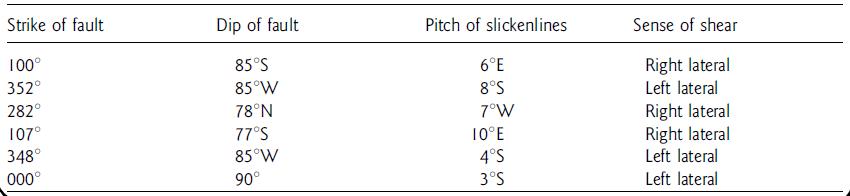
Fig. 10.6d,b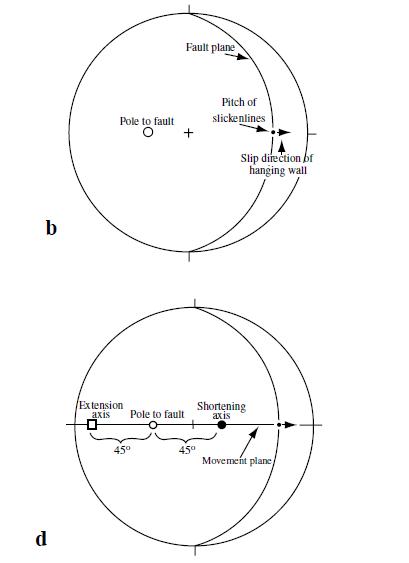
Strike of fault 075 075 241 234 061 062 094 263 055 Dip of fault 65S 40S 32N 37N 51S 45S 30S 22N 22S Pitch of slickenlines 76E 90 88W 86W 83E 82E 75E 73W 80E Dominant slip sense Thrust Thrust Thrust Thrust Thrust Thrust Thrust Thrust Thrust
Step by Step Solution
3.27 Rating (156 Votes )
There are 3 Steps involved in it
To conduct a kinematic analysis of the fault data and test the hypotheses presented well follow these steps Part a Analyze Thrust Faults Step 1 Plot F... View full answer

Get step-by-step solutions from verified subject matter experts