

Question: 13. (***) (Microsoft Excel problem) Recreate the S&OP spreadsheet used in Figures 13.10 and 13.11. (You do not have to build in the optimization model
13. (***) (Microsoft Excel problem) Recreate the S&OP spreadsheet used in Figures 13.10 and 13.11. (You do not have to build in the optimization model using the Solver function.) While your formatting may differ, your answers should be the same. Your spreadsheet should generate new results anytime any of the planning, sales forecast, or hiring/layoff values are changed. To test your spreadsheet, change the planning values to match the following:
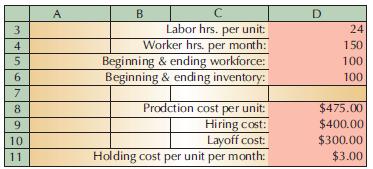 If your spreadsheet works correctly, the new total cost for a level production plan should be $5,769,100, and for a chase production plan, it should be $5,755,600.
345678 A B C Labor hrs. per unit: Worker hrs. per month: Beginning & ending workforce: Beginning & ending inventory: D 24 150 100 100 Prodction cost per unit: $475.00 9 Hiring cost: $400.00 10 Layoff cost: $300.00 11 Holding cost per unit per month: $3.00
Step by Step Solution
There are 3 Steps involved in it

Get step-by-step solutions from verified subject matter experts