

Question: 24. (***) (Microsoft Excel problem) The Excel spreadsheet to the right calculates the upper and lower control limits for an attribute (in this case, the
24. (***) (Microsoft Excel problem) The Excel spreadsheet to the right calculates the upper and lower control limits for an attribute (in this case, the proportion of dissatisfied customers). Recreate this spreadsheet in Excel. You should develop the spreadsheet so that the results will be recalculated if any of the values in the highlighted cells are changed. Your formatting does not have to be exactly the same, but the numbers should be. (As a test, see what happens if you change the sample size to 200. The new UCL and LCL values should be .1542 and .0312, respectively.)
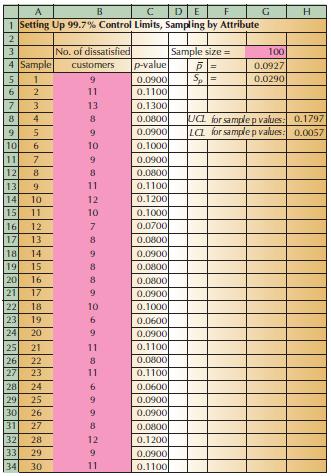
A B C DE F G H 234567ALUE22156769 1 Setting Up 99.7% Control Limits, Sampling by Attribute No. of dissatisfied Sample size = 100 4 Sample customers p-value 0.0927 8 10 11 123456769 0.0900 Sp= 0.0290 11 0.1100 13 0.1300 8 0.0800 UCL for sample p values: 0.1797 9 0.0900 LCL for sample p values: 0.0057 10 0.1000 9 0.0900 8 0.0800 11 10 =2 0.1100 12 0.1200 11 10 0.1000 12 7 0.0700 13 8 0.0800 18 14 9 0.0900 15 8 0.0800 20 16 8 0.0800 22 21 17 9 0.0900 22 18 10 0.1000 231 19 6 0.0600 24 20 9 0.0900 25 21 11 0.1100 26 22 8 0.0800 27 23 11 0.1100 28 24 6 0.0600 29 25 9 0.0900 30 26 9 0.0900 31 27 8 0.0800 32 28 12 0.1200 33 29 9 0.0900 34 30 11 0.1100
Step by Step Solution
There are 3 Steps involved in it

Get step-by-step solutions from verified subject matter experts