

Question: 23. (***) (Microsoft Excel problem) The following Excel spreadsheet calculates the upper and lower control limits for a continuous variable. Recreate this spreadsheet in Excel.
23. (***) (Microsoft Excel problem) The following Excel spreadsheet calculates the upper and lower control limits for a continuous variable. Recreate this spreadsheet in Excel. You should develop the spreadsheet so that the results will be recalculated if any of the values in the highlighted cells are changed. Your formatting does not have to be exactly the same, but the numbers should be. (As a test, see what happens if all five observations in Sample 1 are 40. Your new upper and lower control limits for the sample means should be 36.06 and 34.28, respectively.)
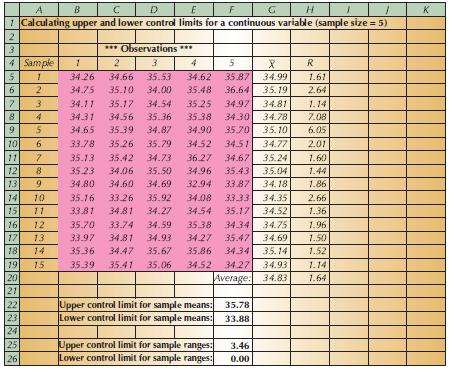
A B C D E F G H 67695455N 2 3 1 Calculating upper and lower control limits for a continuous variable (sample size = 5) ***Observations 4 Sample 1 2 3 4 5 X R 1 34.26 34.66 35.53 34.62 35.87 34.99 1.61 2 34.75 35.10 34.00 35.48 36.64 35.19 2.64 3 34.11 35.17 34.54 35.25 34.97 34.81 1.14 8 4 34.31 34.56 35.36 35.38 34.30 34.78 7.08 9 5 34.65 35.39 34.87 34.90 35.70 35.10 6.05 10 6 33.78 35.26 35.79 34.52 34.51 34.77 2.01 11 7 35.13 35.42 34.73 36.27 34.67 35.24 1.60 12 8 35.23 34.06 35.50 34.96 35.43 35.04 1.44 13 9. 34.80 34.60 34.69 32.94 33.87 34.18 1.86 14 10 35.16 33.26 35.92 34.08 33.33 34.35 2.66 15 11 33.81 34.81 34.27 34.54 35.17 34.52 1.36 16 12 35.70 33.74 34.59 35.38 34.34 34.75 1.96 17 13 33.97 34.81 34.93 34.27 35.47 34.69 1.50 18 14 35.36 34.47 35.67 35.86 34.34 35.14 1.52 19 15 35.39 35.41 35.06 34.52 34.27 34.93 1.14 20 Average: 34.83 1.64 21 22 23 24 25 261 Upper control limit for sample means: Lower control limit for sample means: Upper control limit for sample ranges: Lower control limit for sample ranges: 3.46 0.00 35.78 33.88 K
Step by Step Solution
There are 3 Steps involved in it

Get step-by-step solutions from verified subject matter experts