

Question: 4. (***) (Microsoft Excel problem) The chart at the bottom of the page shows an Excel spreadsheet that calculates the value index for two alternative
4. (***) (Microsoft Excel problem) The chart at the bottom of the page shows an Excel spreadsheet that calculates the value index for two alternative suppliers. Re-create this spreadsheet in Excel. You should develop the spreadsheet so that the results will be recalculated if any of the values in the highlighted cells are changed.Your formatting does not have to be exactly the same, but the numbers should be.
(As a test, see what happens if you change all of the importance scores to 3.Your new value indices for Supplier 1 and Supplier 2 should be 72 and 63, respectively.)
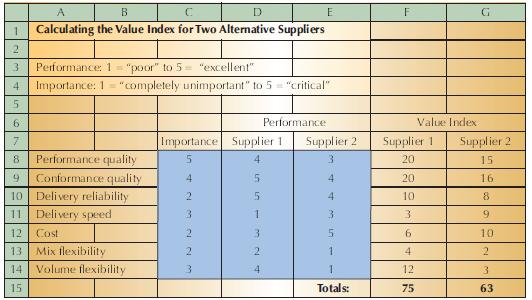
A B 1 Calculating the Value Index for Two Alternative Suppliers 2 3 Performance: 1 "poor" to 5= "excellent" 4 Importance: 1 "completely unimportant" to 5 "critical" 5 E F G 6 7 8 Performance quality 9 Conformance quality 10 Delivery reliability Performance Value Index Importance Supplier 1 Supplier 2 Supplier 1 Supplier 2 5 4. 3 20 15 4 5 4 20 16 11 Delivery speed 3 12 Cost 13 Mix flexibility 14 Volume flexibility 22221 5 4 10 8 1 3 3 9 3 5 6 10 2 1 4 2 3 4 1 12 3 15 Totals: 75 63
Step by Step Solution
There are 3 Steps involved in it

Get step-by-step solutions from verified subject matter experts