

The following graph shows the annual salary for the president of the United States for selected years
Question:
The following graph shows the annual salary for the president of the United States for selected years from 1789 to 2001.
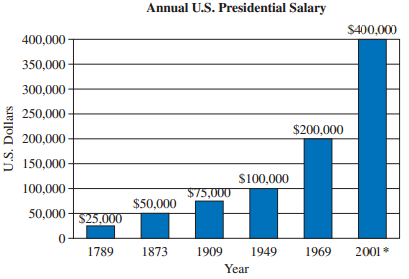
(a) Determine the percent increase in annual salary from 1789 to 1873.
(b) Determine the percent increase in annual salary from 1909 to 1949.
(c) Determine the percent increase in annual salary from 1969 to 2001.
(d) Determine the percent increase in annual salary from 1789 to 2001.
Where appropriate, round your answer to the nearest tenth of percent.
Fantastic news! We've Found the answer you've been seeking!
Step by Step Answer:
a 50000 2500025000 100 1000 incr...View the full answer

Answered By
Mugdha Sisodiya
My self Mugdha Sisodiya from Chhattisgarh India. I have completed my Bachelors degree in 2015 and My Master in Commerce degree in 2016. I am having expertise in Management, Cost and Finance Accounts. Further I have completed my Chartered Accountant and working as a Professional.
Since 2012 I am providing home tutions.
2+ Reviews
10+ Question Solved
Related Book For 

A Survey of Mathematics with Applications
ISBN: 978-0134112107
10th edition
Authors: Allen R. Angel, Christine D. Abbott, Dennis Runde
Question Posted:
