

The graph at the top of the next column shows the land area of the United States,
Question:
The graph at the top of the next column shows the land area of the United States, in millions of square miles, for the years 1790, 1810, 1830, 1850, and 1870.
(a) Determine the percent increase in U.S. land area from 1790 to 1810.
(b) Determine the percent increase in U.S. land area from 1810 to 1830.
(c) Determine the percent increase in U.S. land area from 1830 to 1850.
(d) Determine the percent increase in U.S. land area from 1850 to 1870.
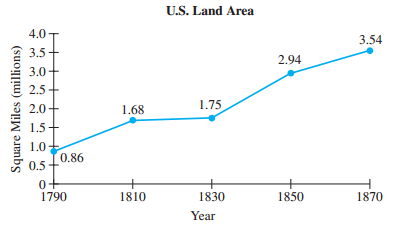
Where appropriate, round your answer to the nearest tenth of percent.
Fantastic news! We've Found the answer you've been seeking!
Step by Step Answer:
a 168 086086 0953 953 incr...View the full answer

Answered By
Bhartendu Goyal
Professional, Experienced, and Expert tutor who will provide speedy and to-the-point solutions. I have been teaching students for 5 years now in different subjects and it's truly been one of the most rewarding experiences of my life. I have also done one-to-one tutoring with 100+ students and help them achieve great subject knowledge. I have expertise in computer subjects like C++, C, Java, and Python programming and other computer Science related fields. Many of my student's parents message me that your lessons improved their children's grades and this is the best only thing you want as a tea...
2+ Reviews
10+ Question Solved
Related Book For 

A Survey of Mathematics with Applications
ISBN: 978-0134112107
10th edition
Authors: Allen R. Angel, Christine D. Abbott, Dennis Runde
Question Posted:
