

a. Estimate the frequency of ringing in Figure 2.13b. DATA FROM FIGURE 2.13B b. Estimate the frequency
Question:
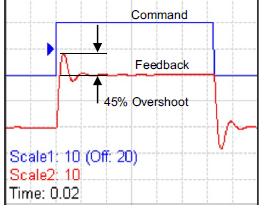
a. Estimate the frequency of ringing in Figure 2.13b.
DATA FROM FIGURE 2.13B
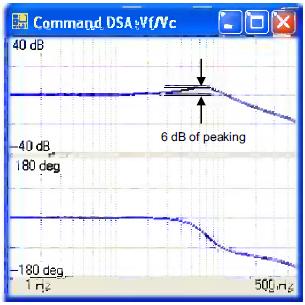
b. Estimate the frequency of maximum peaking in Figure 2.14b, the corresponding Bode plot.
DATA FROM FIGURE 2.14B
c. What conclusion do you draw by comparing a and b?
Step by Step Answer:

This question has not been answered yet.
You can Ask your question!
Related Book For 
Control System Design Guide Using Your Computer To Understand And Diagnose Feedback Controllers
ISBN: 9780123859204
4th Edition
Authors: George Ellis
Question Posted:
