

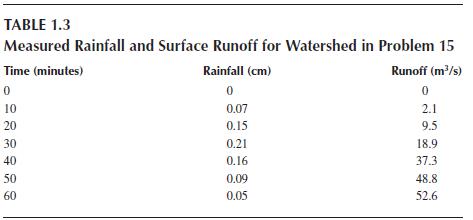
Table 1. 3 shows the measured rainfall and surface runoff from a 50 km 2 watershed. The
Question:
Table 1. 3 shows the measured rainfall and surface runoff from a 50 km2 watershed. The given values are the averages over time intervals. Compute the accumulated storage (m3)
of the water within the watershed. Plot on the same coordination, the inflow, outflow, and cumulative storage as functions of time.
Table 1. 3
Step by Step Answer:

This question has not been answered yet.
You can Ask your question!
Related Book For 
Water Systems Analysis Design, And Planning Urban Infrastructure
ISBN: 9780367528454
1st Edition
Authors: Mohammad Karamouz
Question Posted:
