

Question: Using a computer simulation, investigate the (Q) and (bar{Q}) values in the CMOS RAM cell shown in Figure 16.76 during read and write cycles for
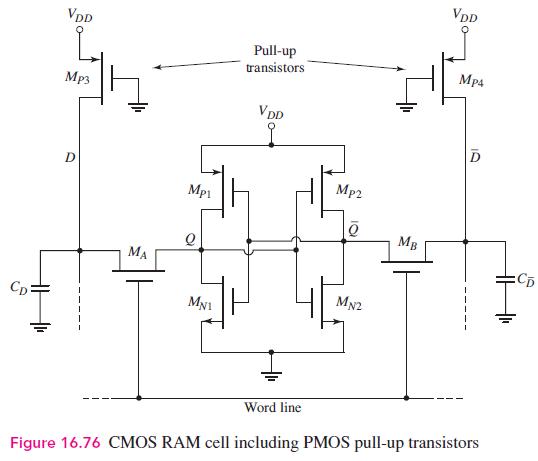
Using a computer simulation, investigate the \(Q\) and \(\bar{Q}\) values in the CMOS RAM cell shown in Figure 16.76 during read and write cycles for various transistor width-to-length ratios. In particular, consider the relations given by Equations (16.82) and (16.84).
Figure 16.76:-
Equation 16.82 and 16.84:-


CD VDD VDD Pull-up transistors Mp4 Mp3 VDD D Mp1 Mp2 MB Q MA CD MNI MN2 Word line Figure 16.76 CMOS RAM cell including PMOS pull-up transistors
Step by Step Solution
★★★★★
3.38 Rating (145 Votes )
There are 3 Steps involved in it
1 Expert Approved Answer
Step: 1 Unlock

Question Has Been Solved by an Expert!
Get step-by-step solutions from verified subject matter experts
Step: 2 Unlock
Step: 3 Unlock