

Question: Using a computer simulation, plot (V_{C E}) versus (V_{1}) over the range (0 leq V_{I} leq 8 mathrm{~V}) for the circuit in Figure 5.24(a). At
Using a computer simulation, plot \(V_{C E}\) versus \(V_{1}\) over the range \(0 \leq V_{I} \leq 8 \mathrm{~V}\) for the circuit in Figure 5.24(a). At what voltage does the transistor turn on and at what voltage does the transistor go into saturation?
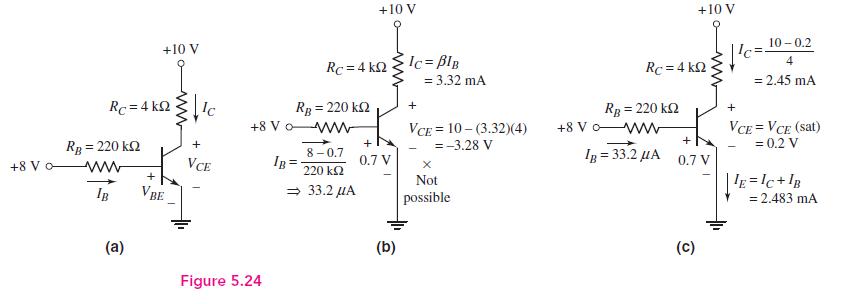
+8 V o +10 V +10 V Rc=4kQ 10-0.2 = 4 = 2.45 mA + RB = 220 k + VCE 10-(3.32)(4) +8 V WW + IB=33.2 A 0.7 V VCE = VCE (sat) = 0.2 V |E=IC+IB = 2.483 mA +10 V Rc=4kQ Ic Rc=4kQ RB = 220 ks +8 VW Ic=IB = 3.32 mA RB = 220 k + - ww VCE IB = 8-0.7 220 0.7 V IB VBE 33.2 A Not =-3.28 V possible (a) Figure 5.24 (c)
Step by Step Solution
There are 3 Steps involved in it
1 Expert Approved Answer
Step: 1 Unlock

Question Has Been Solved by an Expert!
Get step-by-step solutions from verified subject matter experts
Step: 2 Unlock
Step: 3 Unlock