

Question: 11.12. Consider the three-variable central composite design shown in Table P11.6. Analyze the data and draw conclusions, assuming that we wish to maximize conversion (y1)
11.12. Consider the three-variable central composite design shown in Table P11.6. Analyze the data and draw conclusions, assuming that we wish to maximize conversion (y1) with activity (y2) between 55 and 60.
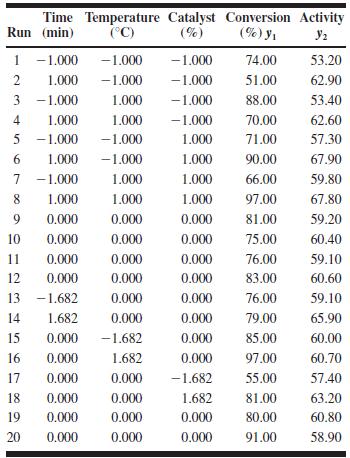
Time Temperature Catalyst Conversion Activity Run (min) (C) (%) (%) Y 32 1 -1.000 -1.000 -1.000 74.00 53.20 234567890 1.000 -1.000 -1.000 51.00 62.90 3 -1.000 1.000 -1.000 88.00 53.40 1.000 1.000 -1.000 70.00 62.60 5 -1.000 -1.000 1.000 71.00 57.30 1.000 -1.000 1.000 90.00 67.90 7 -1.000 1.000 1.000 66.00 59.80 1.000 1.000 1.000 97.00 67.80 0.000 0.000 0.000 81.00 59.20 10 0.000 0.000 0.000 75.00 60.40 11 0.000 0.000 0.000 76.00 59.10 12 0.000 0.000 0.000 83.00 60.60 13 -1.682 0.000 0.000 76.00 59.10 14 1.682 0.000 0.000 79.00 65.90 15 0.000 -1.682 0.000 85.00 60.00 16 0.000 1.682 0.000 97.00 60.70 17 0.000 0.000 -1.682 55.00 57.40 18 0.000 0.000 1.682 81.00 63.20 19 0.000 0.000 0.000 80.00 60.80 20 0.000 0.000 0.000 91.00 58.90
Step by Step Solution
There are 3 Steps involved in it

Get step-by-step solutions from verified subject matter experts