

Question: 12.11. An experiment has been run in a process that applies a coating material to a wafer. Each run in the experiment produced a wafer,
12.11. An experiment has been run in a process that applies a coating material to a wafer. Each run in the experiment produced a wafer, and the coating thickness was measured several times at different locations on the wafer. Then the mean y1 and the standard deviation y2 of the thickness measurement were obtained. The data [adapted from Box and Draper
(2007)] are shown in the Table P12.1:
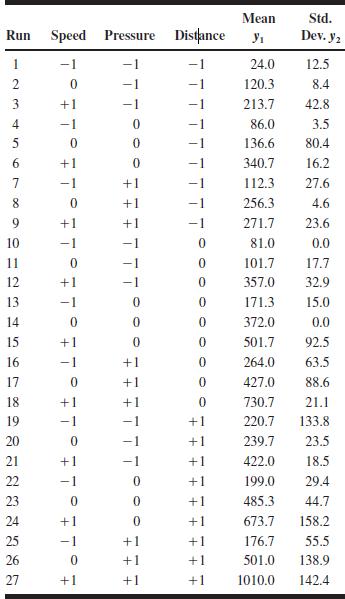
(a) What type of design did the experimenters use? Is this a good choice of design for fitting a quadratic model?
(b) Build models of both responses.
(c) Find a set of optimum conditions that result in the mean as large as possible with the standard deviation less than 60.
Mean Std. Run Speed Pressure Distance y Dev. y2 -1 24.0 12.5 4 234 0 120.3 8.4 213.7 42.8 86.0 3.5 5 0 0 136.6 80.4 10 67890 +1 0 340.7 16.2 +1 112.3 27.6 0 +1 256.3 4.6 +1 271.7 23.6 -1 81.0 0.0 11 0 0 101.7 17.7 12 13 14 15 16 17 1+ +1 0 357.0 32.9 0 171.3 15.0 0 0 372.0 0.0 + 1 0 0 501.7 92.5 -1 +1 0 264.0 63.5 0 +1 0 427.0 88.6 18 19 + 1 +1 -1 0 730.7 21.1 +1 220.7 133.8 20 0 +1 239.7 23.5 21 22 1+ +1 422.0 18.5 -1 +1 199.0 29.4 23 0 0 485.3 44.7 24 0 +1 673.7 158.2 25 -1 +1 +1 176.7 55.5 26 0 +1 +1 501.0 138.9 27 +1 +1 +1 1010.0 142.4
Step by Step Solution
There are 3 Steps involved in it

Get step-by-step solutions from verified subject matter experts