

An experiment has been run in a process that applies a coating material to a wafer. Each
Question:
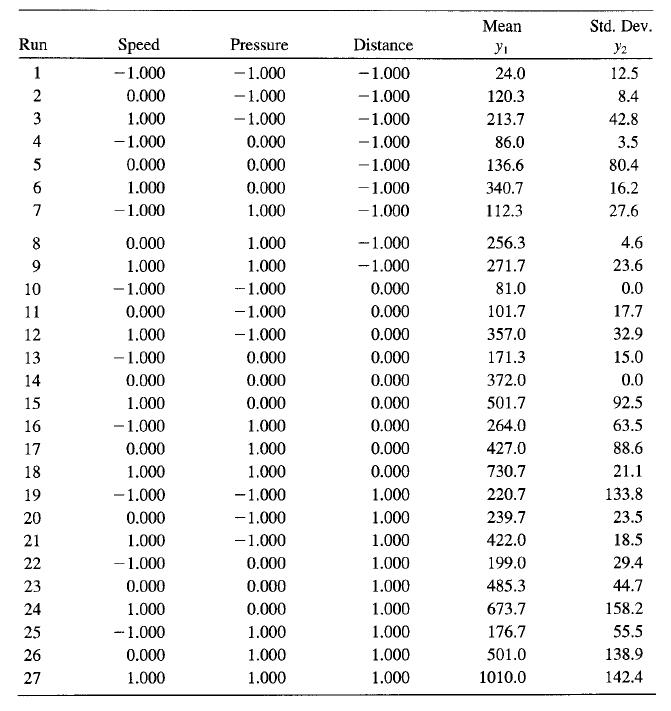
An experiment has been run in a process that applies a coating material to a wafer. Each run in the experiment produced a wafer, and the coating thickness was measured several times at different locations on the wafer. Then the mean y1 and standard deviation y2 of the thickness measurement was obtained. The data [adapted from Box and Draper (1987)] are shown in the table below:
(a) What type of design did the experimenters use? Is this a good choice of design for fitting a quadratic model?
(b) Build models of both responses.
(c) Find a set of optimum conditions that result in the mean as large as possible with the standard deviation less than 60.
Fantastic news! We've Found the answer you've been seeking!
Step by Step Answer:

Answered By
Bhartendu Goyal
Professional, Experienced, and Expert tutor who will provide speedy and to-the-point solutions. I have been teaching students for 5 years now in different subjects and it's truly been one of the most rewarding experiences of my life. I have also done one-to-one tutoring with 100+ students and help them achieve great subject knowledge. I have expertise in computer subjects like C++, C, Java, and Python programming and other computer Science related fields. Many of my student's parents message me that your lessons improved their children's grades and this is the best only thing you want as a tea...
2+ Reviews
10+ Question Solved
Related Book For 

Question Posted:
