

Question: A certain low-pass filter has the Bode diagram shown in Figure P123. (a) How many dB down is the filter at 5000 rad/s? (b) Estimate
A certain low-pass filter has the Bode diagram shown in Figure P12–3.
(a) How many dB down is the filter at 5000 rad/s?
(b) Estimate where the cutoff frequency occurs, then determine how many dB down is the filter at one decade after the cutoff frequency?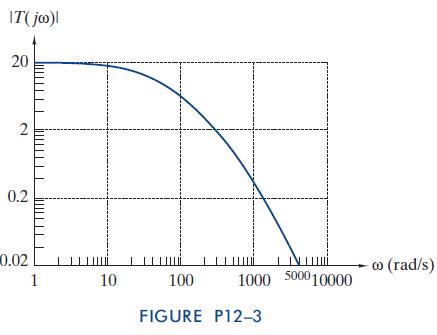
70 0.2 0.02 IT(joo)| 20 2 w (rad/s) 1 10 100 1000 500010000 FIGURE P12-3
Step by Step Solution
There are 3 Steps involved in it
1 Expert Approved Answer
Step: 1 Unlock

Question Has Been Solved by an Expert!
Get step-by-step solutions from verified subject matter experts
Step: 2 Unlock
Step: 3 Unlock