

Question: A certain low-pass filter has the Bode diagram shown in Figure P12-8. (a) At what frequency is the filter (10 mathrm{~dB}) down? (b) Estimate where
A certain low-pass filter has the Bode diagram shown in Figure P12-8.
(a) At what frequency is the filter \(10 \mathrm{~dB}\) down?
(b) Estimate where the cutoff frequency occurs, then determine how many \(\mathrm{dB}\) down is the filter at two octaves after the cutoff frequency?
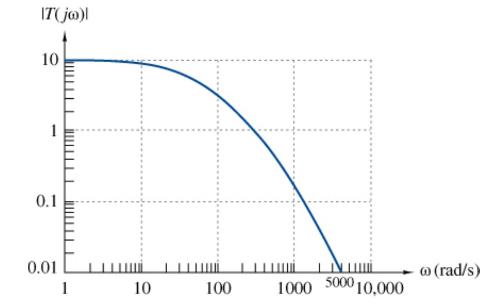
IT(jo) 10 0.1 0.01 | 1 | 1 10 100 1000 5000 10,000 o (rad/s)
Step by Step Solution
★★★★★
3.43 Rating (153 Votes )
There are 3 Steps involved in it
1 Expert Approved Answer
Step: 1 Unlock

a b Find the amplitude at 10 dB noting ... View full answer
Question Has Been Solved by an Expert!
Get step-by-step solutions from verified subject matter experts
Step: 2 Unlock
Step: 3 Unlock