

Question: The Bode plot of a dynamic system is shown in Figure 10.95, in which the asymptotes are also given. Following the rules of sketching Bode
The Bode plot of a dynamic system is shown in Figure 10.95, in which the asymptotes are also given. Following the rules of sketching Bode plots, find the transfer function of the system.
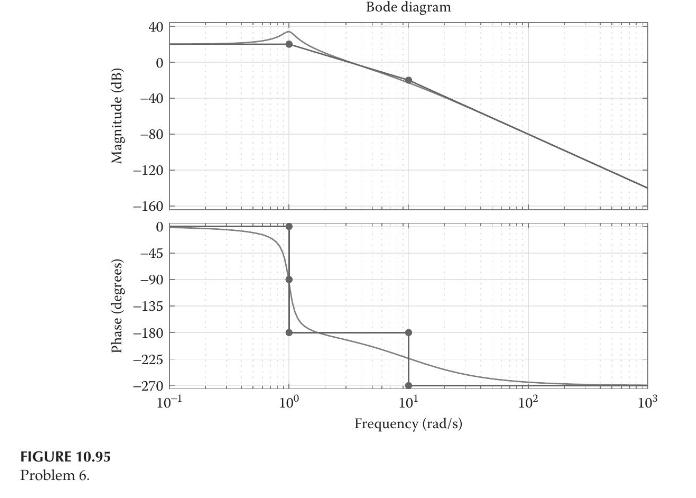
FIGURE 10.95 Problem 6. Phase (degrees) Magnitude (dB) -40 -80 -120 -160 -45 -90 -135 0 40 0 Bode diagram -180 -225 -270 10-1 10 10 102 103 Frequency (rad/s)
Step by Step Solution
★★★★★
3.31 Rating (160 Votes )
There are 3 Steps involved in it
1 Expert Approved Answer
Step: 1 Unlock

Question Has Been Solved by an Expert!
Get step-by-step solutions from verified subject matter experts
Step: 2 Unlock
Step: 3 Unlock