

A professor gave the following quiz to his students: Look at Figure P12-42. Each curve represents the
Question:
A professor gave the following quiz to his students:
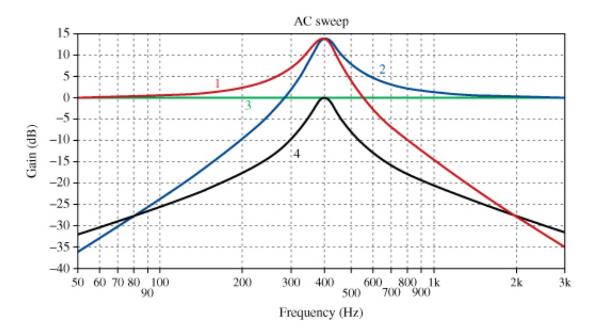
Look at Figure P12-42. Each curve represents the voltage across an individual element in a series \(R L C\) circuit. Identify which curve belongs to which element, namely, \(R, L, C\), or \(V_{1}\). Then explain how there can be two voltages greater than \(1(\mathrm{odB}\) when the input \(V_{1}\) is at \(\mathrm{O} \mathrm{dB}\) ?
Fantastic news! We've Found the answer you've been seeking!
Step by Step Answer:
The magnitude of the voltage source V is constant so it corresponds to curve 3 which is a straight l...View the full answer

Answered By
Latha Rodda
I am a civil engineering graduate with required knowledge and skills to be an asset to the students. Although I don't have any tutoring experience I am damn sure that I can help the students very with my academic experiences.
0 Reviews
10+ Question Solved
Related Book For 
The Analysis And Design Of Linear Circuits
ISBN: 9781119913023
10th Edition
Authors: Roland E. Thomas, Albert J. Rosa, Gregory J. Toussaint
Question Posted:
