

A lot of attention has been paid recently to portion size in restaurants, and how it may
Question:
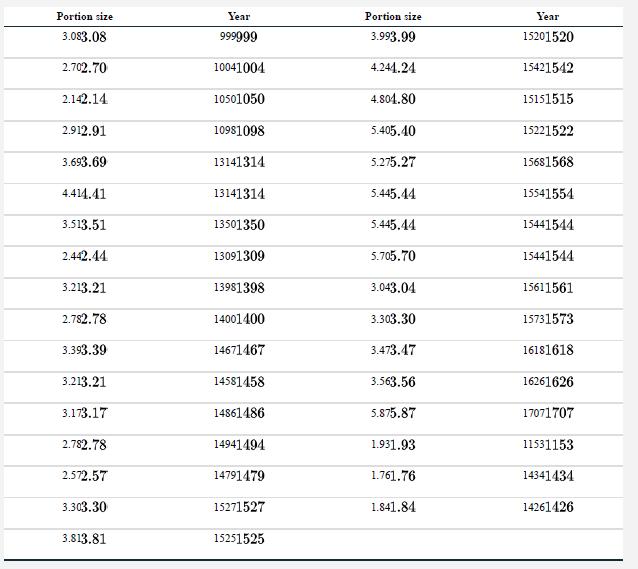
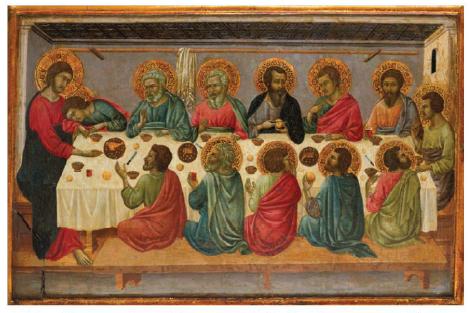
A lot of attention has been paid recently to portion size in restaurants, and how it may affect obesity in North Americans. Portions have grown greatly over the last few decades. But is this phenomenon new? Wansink and Wansink (2010) looked at representations of the Last Supper in European paintings painted between about 1000 AD and 1700 AD. They scanned the images and measured the size of the food portions portrayed (relative to the sizes of heads in the painting). (For example, the painting reproduced here was painted by Ugolino di Nerio in 1234 AD.) They reported the year of the painting and the portion size as follows:
a. Calculate a regression line that best describes the relationship between year of painting and the portion size. What is the trend? How rapidly has portion size changed in paintings?
b. What is the most-plausible range of values for the slope of this relationship? Calculate a 95% confidence interval.
c. Test for a change in relative portion size painted in these works of art with the year in which they were painted.
d. Draw a residual plot of these data and examine it carefully. Can you see any cause for concern about using a linear regression? Suggest an approach that could be tried to address the problem.
Step by Step Answer:
Answer We are going to use excel to solve this problem Enter the data in excel and then plot the scatterplot as follows Portion size Year Year 308 999 ...View the full answer


The Analysis Of Biological Data
ISBN: 9781319226237
3rd Edition
Authors: Michael C. Whitlock, Dolph Schluter
